Policy
Two Point One - Global Fertility Rates and Canada's Situation
1. Introduction: The Quietest Crisis
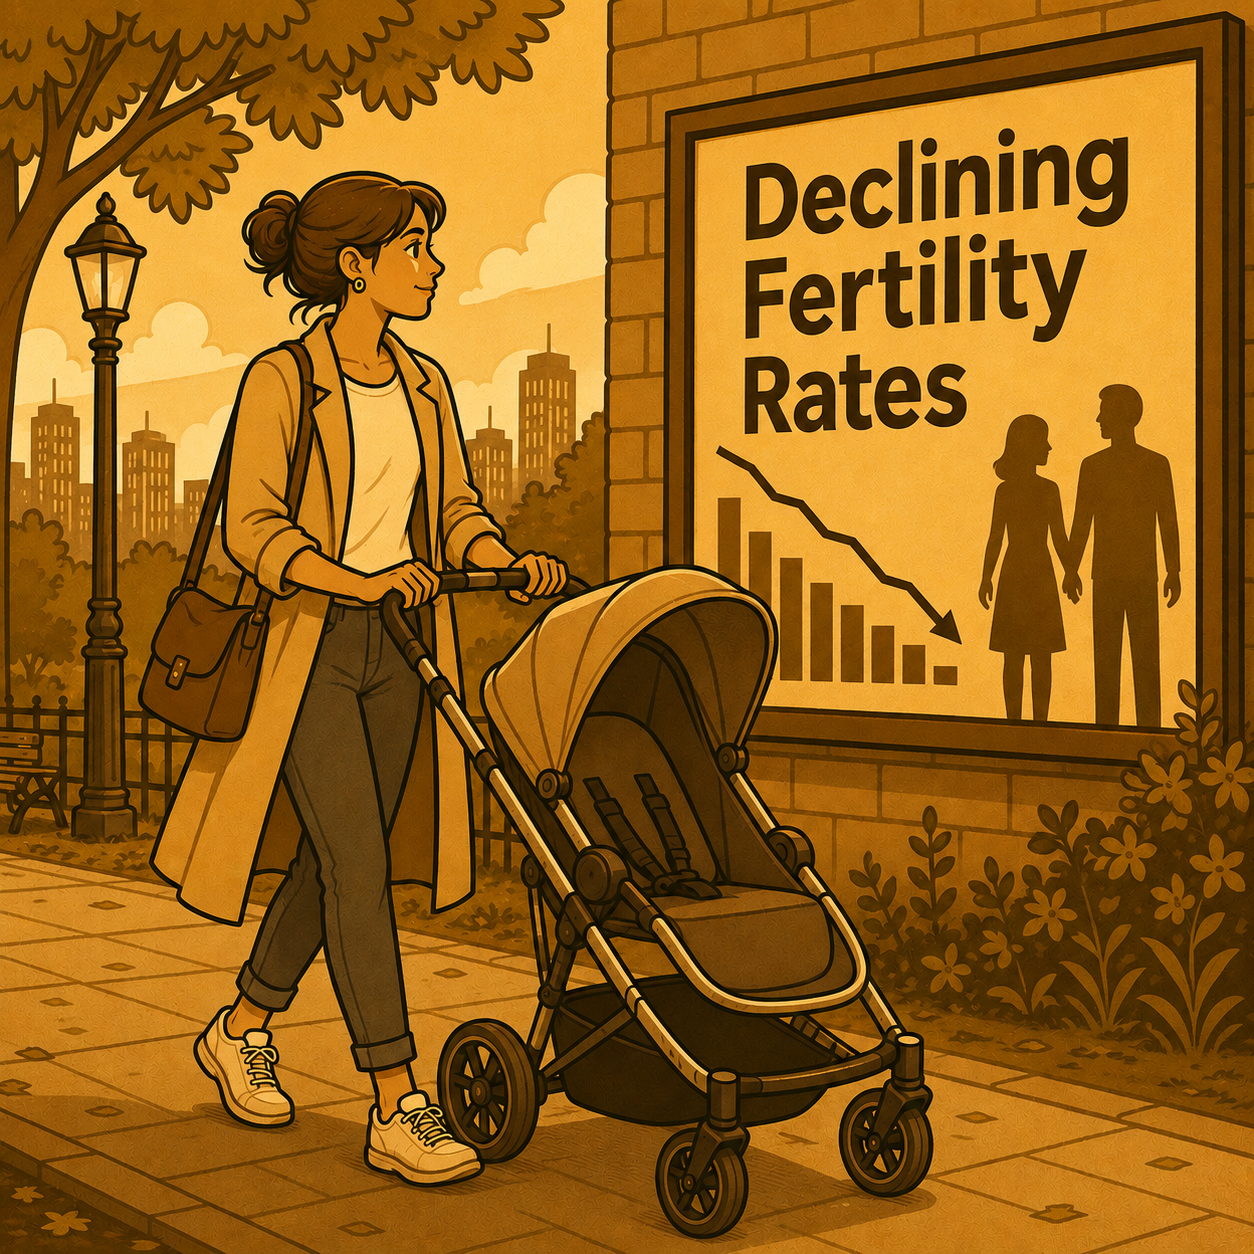
Some crises announce themselves. Tsunamis begin with sirens; financial panics begin with a screen full of red. Demographic decline begins with silence: a maternity ward that closes for a lack of patients, a rural school that graduates its final class, a census-population line that bends downward and never bends back up. Japan’s former prime minister Shigeru Ishiba called his country’s collapsing birth rate a “silent emergency” (CNN, 2025), and that phrase travels well beyond Japan, because the silence is now nearly universal. Fertility is declining on every continent, in rich countries and poor ones, in secular societies and religious ones, under pronatalist governments and indifferent ones alike (United Nations [UN DESA], 2025).
At the centre of this story sits a single, deceptively modest number: the replacement rate. In developed countries with low mortality, the replacement rate is usually set at about 2.1 children per woman, this is the average number of births each woman would need to have over her lifetime for one generation to fully replace the one before it. In a developed, low mortality country that has a replacement rate of 2.1, if each woman delivers on average 2.1 births over her lifetime, then the population of that country will hold constant in the absence of migration (UN DESA, 2025; Espenshade et al., 2003). Above 2.1, a population grows under its own power. Below it, a population begins to shrink and to age, slowly at first, but with compounding force. The replacement rate functions like sea level does in geography: everything on the map is defined by whether it sits above or below the line.
Most of our map is now underwater. As of 2024, 131 of the 237 countries and areas tracked by the United Nations had fertility below 2.1 (UN DESA, 2025), and by 2025 roughly 71 per cent of the global population lived in a below-replacement country (Visual Capitalist, 2026a). The global average itself has fallen from 4.9 births per woman in the early 1950s to 2.2 today, and the UN projects it will cross beneath replacement within decades, reaching about 1.8 by century’s end (Our World in Data, 2025; UN DESA, 2025).
Before we get into why this decline is occurring, we need to understand why a reader of geopolitics should care about a fertility statistic in the first place. It’s simple: Because population levels are the foundation of nearly everything else states do. Labour forces, tax bases, pension systems, housing markets, armies, and electorates are all fundamentally functions of demography. A country’s fertility rate today is a preview of its economic and strategic position thirty years from now. This essay unpacks the replacement rate in full: what it is and why it is 2.1 rather than 2.0 (Section 2); how the world arrived here (Section 3); where fertility stands today (Section 4); what falling below the line actually costs (Section 5); how three very different countries — Japan, Canada, and Hungary — are living with the consequences (Section 6); what is driving the decline (Section 7); what, if anything, can be done (Section 8); and finally what all of this means for Canada, a country whose entire demographic model is an ongoing policy experiment (Section 9).
2. Understanding the Replacement Rate
2.1 The total fertility rate
The statistic underlying this whole discussion is the total fertility rate (TFR). In plain terms, it estimates how many children the average woman will have in her lifetime (Pew Research Center, 2025). But there’s a catch worth understanding: a woman’s childbearing years span roughly three decades, so if you followed a real generation from start to finish in an effort to understand how many babies they have on average, your answer would be thirty years out of date. Instead, statisticians look at a single year, note how many babies women of each age are having right now, and add those rates together to build one imaginary woman’s “lifetime.” It’s less like following a single car on its entire journey and more like standing on a street corner for one day and estimating the traffic from what rolls past.
It should be noted however, that this shortcut has a blind spot. Since the TFR is built from just one year, it captures timing as well as quantity, meaning if women across a society start having children later — in their thirties instead of their twenties — then in any given year it looks as though births have collapsed, when in reality births have simply been pushed down the road (UN DESA, 2025). This phenomenon is known to demographers as a tempo effect, and it’s why a single year’s fluctuations should be read with caution (Lutz et al., 2024).
But when the TFR sits far below replacement for decades, as it now has across much of the world, delay alone cannot explain the gap. The children aren’t merely arriving late; increasingly, they are not arriving at all (Kearney & Levine, 2022).
2.2 Why 2.1 and not 2.0
Intuition tells us that two parents need to birth two children in order to replace themselves, so the replacement rate should be exactly 2.0. But the number is 2.1? Why? Well two corrections push the number upward. First, the sex ratio at birth is not even: roughly 105 boys are born for every 100 girls, which means that more than half of all births are children who will never themselves give birth (Espenshade et al., 2003). Second, mortality intervenes: not every girl born survives to the mean age of motherhood. Therefore, in wealthy countries where child-mortality is very low, slightly more than 2 children must come from each woman on average in order for 2 children to replace both their parents. In wealthy countries the required fertility works out to just about 2.1, but where child and young-adult mortality remain high, the bar rises steeply.
That last point deserves emphasis, because the popular shorthand “the replacement rate is 2.1 everywhere” is wrong. Espenshade, Guzman and Westoff (2003) showed that replacement-level fertility varies enormously across countries: from just under 2.1 in the healthiest societies to nearly 3.5 in the highest-mortality ones. Almost all of the variation is driven by differences in survival rather than in the aforementioned sex ratio. In a country where only 60 per cent of women survive to the mean age of fertility, as was the case in places like Sierra Leone, a TFR of 2.5 can still mean a shrinking population because their effective replacement rate is so high. So, in other words, the 2.1 figure is a low-mortality privilege that presumes modern medicine and safe society (Espenshade et al., 2003; Cuaresma et al., 2019).
2.3 Developed versus developing worlds
This is why the replacement conversation looks so different across the development divide. Developed countries cluster tightly around a 2.1 replacement threshold they nonetheless fail to reach — Europe’s average fertility is now about 1.4 and Northern America’s about 1.6 (Pew Research Center, 2025). Meanwhile, many developing countries sit above a 2.1 TFR while facing higher replacement thresholds because of mortality. As their health systems improve, their replacement bar falls toward 2.1.
What’s striking is that every region in the world was above replacement in 1950. North America fell below in 1972, Europe in 1975, Latin America and the Caribbean in 2014, Asia in 2019, and Oceania is projected to follow in 2028, leaving Africa as the only region above the line (Pew Research Center, 2025).
3. Historical Context: From Explosion to Implosion
3.1 The demographic transition
For nearly all of recorded history, high fertility was not a choice, it was a necessity. It was a hedge against mortality that routinely claimed a third or more of children before adulthood. Populations grew slowly because death kept pace with birth. This equilibrium was broken by the industrial era in a predictable sequence that demographers call the demographic transition: first mortality falls (from increased sanitation, access to vaccines, food security etc.), producing a generation or two of explosive growth; then fertility rates drop as parents adjust to the new reality that the children they bear will actually survive. This transition is what explains the world’s population boom from about 2.6 billion in 1950 to 8.2 billion today (UN, 2024; World Bank, 2025).
Global fertility was driven down by a braid of forces. Industrialization moved work out of the household, which converted children from farmhands (economic assets) into dependents requiring long, costly investments (schooling, healthcare etc.). Urbanization shrank living space and increased the price of raising a family. Above all though, was the transformation in women’s lives: education, workforce participation, and reliable contraception gave half the population alternatives to early and repeated motherhood, and the age of first-time motherhood began its long march upward (World Bank, 2025; Statistics Canada, 2025). None of these forces has ever gone into reverse, and that is the essential historical fact of this subject: once a society’s fertility falls it doesn’t tend to climb back up.
3.2 The baby boom: the exception that proved the rule
The post-war baby boom which is sometimes cited as a counterexample to perpetually declining fertility rates in developed countries turns out, upon further inspection to reinforce the pattern. Between the late 1940s and early 1960s, fertility surged across the West: Japan for example recorded 2.7 million births in 1949, which was its all-time peak (CNN, 2025), and Canada’s TFR reached an all-time high of 3.94 children per woman in 1959 (Statistics Canada, 2025; Todayville, 2025). But the boom was actually just a burst of catch-up since marriages and births were deferred through two decades of depression and war, add to that the brief cultural moment of domestic idealism. When the underlying transition reasserted itself in the mid-1960s, aided by the contraceptive pill, fertility fell with astonishing speed and never recovered. The boomers themselves became the demographic wave that economies surfed for fifty years; and their retirement is now the global undertow (Global News, 2025).
3.3 The world after the boom
Since 1950, fertility has declined in every region of the world without exception (Pew Research Center, 2025). Globally, women now bear on average one child fewer than they did as recently as 1990 — 2.2 versus 3.3 (UN DESA, 2025). Even in Africa, which is the highest-fertility region, births per woman have moved from 6.5 in 1950 to 4.0 today, and the UN projects it will reach 2.0 by 2100 (Pew Research Center, 2025). The UN projects that the world’s population will peak at around 10.3 billion in the mid-2080s and then begin to fall (UN, 2024). Humanity has spent two centuries learning to manage growth. It has essentially no experience managing the opposite.
4. Current Global Trends: A Tour of the Map
4.1 East Asia: the deep end
If below-replacement fertility is the world’s new sea level, East Asia is the Mariana Trench. South Korea holds the record for world’s lowest TFR, bottoming out at 0.72 as in 2023. This figure is barely a third of replacement, and it’s the lowest rate ever recorded by any nation (Time, 2024; Xinhua, 2026). The arithmetic of such a number is scary: if a country sustains 0.72, that means each generation is roughly one-third the size of its parents’ generation. South Korea has however seen two recent years of recovery, in 2024 they climbed to 0.75 and in 2025 they reached 0.80, on the strength of rebounding marriages rates (Nikkei Asia, 2026; Xinhua, 2026), but a rate of 0.80 still implies a population falling by more than half every two generations. Celebrating it as a turnaround would be wrong.
Japan is the trench’s most studied resident. In 2024 it recorded 686,061 births which was the first time the country birthed less than 700,000 people since they began keeping records in 1899, and roughly one quarter of its 1949 peak (CNN, 2025). 2025 came in lower still: 671,236 births to Japanese nationals, which marked a tenth consecutive annual record low (The Japan Times, 2026; Semafor, 2025). Deaths outnumbered births by more than 918,000, which their nineteenth straight year of population decline that is now erasing the equivalent of a mid-sized city annually (Tokyo Weekender, 2026). Japan’s population of about 122 million is projected to fall to 87 million by 2070, and at that point about 40 per cent of residents will be over 65 (CNN, 2025).
China has also recently found themselves in the deep end, and the most geopolitically consequential country in the region. Births fell by 17 per cent in a single year, from 9.54 million in 2024 to 7.92 million in 2025, which is the lowest birth rate since the founding of the People’s Republic in 1949. This plummeting birthrate was up against 11.31 million deaths, meaning the country lost ~3 million people (PBS News, 2026). China’s TFR is now sitting around 1.0 (Pew Research Center, 2025). The driving force behind their wanning population growth is of course the infamous one-child policy. Enforced from 1979 to 2015, it succeeded so well that it hollowed out the very generation who would need to bear children today: the number of Chinese women aged 20 to 34 is projected to fall from 105 million in 2025 to 58 million by 2050 (Yi, 2026). The UN’s medium projection has China’s population plunging from 1.4 billion today to 633 million by 2100 (UN, 2024). A reversal of this magnitude has never occurred in peacetime, and it’s unfolding in the country that aspires to displace the United States as the world’s leading power.
4.2 The high-fertility exceptions
At the other end of the spectrum we have sub-Saharan Africa which is the world’s demographic engine, with a population-weighted fertility rate of about 4.0. The Democratic Republic of the Congo sits at 5.90, Somalia at 5.91 and Chad is presently at the top of the table with 5.90 (Visual Capitalist, 2026a). An emphasis should be placed on the sheer scale of these numbers: Nigeria alone is expected to record about 7.6 million births in 2025 — more than all of Europe combined — and is projected to surpass the United States in population before 2050 (Visual Capitalist, 2025). Parts of the Middle East and Central and South Asia also remain above replacement. India, though now slightly below replacement, still contributes more than 23 million births a year which comes out to nearly one in six worldwide, simply because of the enormous size of its childbearing cohorts (Visual Capitalist, 2025). India is a great example of population momentum: like a supertanker after the engines are cut, a young population keeps growing for decades after fertility falls, because so many future parents are already alive.
4.3 Immigration: the great redistribution
For below-replacement countries, immigration is the only lever that adds people to the population immediately, and it adds them pre-grown — typically young adults whose childhood and education were paid for elsewhere. It has become the critical piece of demographic stability across the Anglosphere in particular. The United States sits at a fertility rate of about 1.6 and yet continues to grow thanks immigration (Pew Research Center, 2025), while Canada has made immigration virtually the entirety of its growth model. But migration redistributes people; it does not create them. In a world where 71 per cent of humanity already lives in a country with a TFR below replacement (Visual Capitalist, 2026a), the global pool of potential migrants is itself a rapidly shrinking resource, and this essay will return to that point.
5. Why Falling Below Replacement Matters
Doesn’t fewer people means cheaper housing, emptier highways, a lighter footprint on the planet? The UN itself has noted that an earlier, lower population peak could ease environmental pressures (UN, 2024). These aren’t frivolous points, but the costs of sustained below-replacement fertility are devastating to the way we have organized our societies. The problem is not that populations get smaller; it is the shape they assume on the way down.
5.1 The economics: an inverting pyramid
A healthy population pyramid is wide at the base: lots of workers supporting few retirees. Sustained sub-replacement fertility flips it, think of an hourglass with the sand running upward. Every pay-as-you-go pension and public health system on earth was designed for the pyramid, not the inverted hourglass. Societies need workers to generate economic output so that the taxes generated from that output can find the social programs that the old rely on. In the United States, the ratio of workers to Social Security beneficiaries has fallen from 4.0 in 1964 to 2.7 today, which has been consistently tightening the fiscal vise on entitlement programs funded by payroll taxes (Aspen Economic Strategy Group, 2025). In China, 323 million people, which is 23 per cent of their population, it already over 60, and their working-age population shrinks is only shrinking (PBS News, 2026). Japan’s deaths-over-births gap of nearly a million a year lands on a health and eldercare system that has to be financed by an ever-smaller base of workers (Tokyo Weekender, 2026).
Beyond fiscal strain exists another cost: growth itself. A shrinking labour force drags on GDP directly which puts pressure on innovation and productivity to fill the gap. There is also a compositional effect that many markets are only beginning to realize: older societies save, spend, and take risks differently. Consumption tilts from housing and child-rearing toward health care and leisure; entrepreneurship and labour mobility tend to thin (Newbold, in McMaster University, 2026). This puts further strain on domestic commercial investment and talent development.
5.2 The social fabric: ghost towns and lonely ages
The social costs of low fertility rates arrive earlier and more visibly than the fiscal ones, and they arrive unevenly: young people leave shrinking towns for cities, taking future births with them, thereby accelerating the aging process of the town. Japan has become the world’s flagship country for this process with shuttered schools repurposed or abandoned as enrolment vanishes (CNN, 2025), and a national inventory of empty homes, the akiya, that has become shorthand for rural decline. In South Korea “regional extinction” is a policy category (Kim & Chung, in Clinical and Experimental Pediatrics, 2025). Within families, ultra-low fertility produces another type of transformation: the thinning of kinship. In a one-child society, children grow up without siblings; their children will have no aunts, uncles, or cousins. The extended family, which has long been humanity’s oldest welfare state, shrinks to a vertical line, precisely as the number of elderly needing care explodes and the risk of isolation in old age rises (McMaster University, 2026).
5.3 The politics: everything becomes demographic policy
Governments are now treating family size as strategy with pronatalist budgets in Budapest and Seoul, a dedicated population ministry proposed in Korea (Al Jazeera, 2025), and huge childcare subsidies rolled out in Beijing (Wikipedia, 2026). Where babies are scarce, immigration becomes the substitute, and immigration has become one of the most controversial topics in contemporary democratic politics, as debates from the United States to Europe to, lately, Canada attest. There is also a gerontocratic drift: older voters turn out at higher rates and vote for their interests, which naturally tilts fiscal priorities toward pensions and health care and away from the young families (McMaster University, 2026). And looming over all of it is hard power, for example the Japanese government explicitly frames its birth dearth as a national-security problem since soldiers, like taxpayers, have to be born before they can serve (CNN, 2025).
6. Three Countries, Three Strategies
Consider three countries that have answered the below-replacement condition in three different ways: Japan, which largely accepted decline; Canada, which outsourced growth to immigration; and Hungary, which declared demographic war and opened the treasury.
6.1 Japan: managing the descent
Japan is the control group of global demography, they fell below replacement early (in the 1970s), kept immigration minimal, and let the consequences unfold. The consequences have been remarkably orderly and remarkably relentless. Births have set a record low for ten consecutive years (The Japan Times, 2026); and the population is on track to shed roughly 30 per cent by the 2070s, with two in five residents over 65 (CNN, 2025). Prime Minister Sanae Takaichi has called the fertility crisis the country’s biggest problem, which is notable in a nation that remains deeply sceptical of large-scale immigration (Semafor, 2025). At the same time Japan also shows that decline does not mean apocalypse: they remain one of the richest, safest, and most technologically formidable countries in the world. What Japan cannot demonstrate though is an exit. Its trajectory illustrates the central trap of ultra-low fertility which is that each smaller generation makes the next recovery mathematically harder, because even a rebound in births per woman is multiplied against ever-fewer potential mothers.
6.2 Canada: growth by invitation
Canada took the opposite approach though, its fertility rate has been below replacement since the 1970s and is currently sitting at a record-low 1.25 which is considered “ultra-low territory” alongside Japan and Finland (Statistics Canada, 2025, 2026). Rather than accept Japanese-style contraction, Canada substituted births for immigrants at a scale unmatched in the G7. And this substitution runs deeper than most Canadians even realize: without foreign-born mothers, the total number of births in Canada would have been declining since 2010. By 2024 more than two in five newborns (42.3 %) had a mother born outside the country (Statistics Canada, 2026). Permanent-resident admissions peaked at a record 484,000 in 2024 before the federal government, cut targets to 380,000 annually for 2026–2028 because of housing and infrastructure shortages. With this move they aimed to shrink the temporary-resident population whose share of the total population had exploded from 3.3% in 2018 to 7.5% in 2024, to below 5 per cent (Office of the Parliamentary Budget Officer [PBO], 2026; Gowling WLG, 2025). The Parliamentary Budget Officer projects roughly flat population growth in 2026, which would be a second consecutive year of stagnation, before growth stabilizes near 0.8% (PBO, 2026). Canada’s “immigration-as-a-substitute” model works only while the intake valve stays open; Section 9 of this paper will examine what happens when a country discovers that its only source of growth is also its most contested policy.
6.3 Hungary (and Poland): buying the birth rate
Hungary is the world’s boldest attempt to solve the low-fertility challenge by throwing money at the problem. Since 2010, Viktor Orbán’s government has built an arsenal of pronatalist policies including zero-interest “baby-expecting” loans forgiven upon childbearing, lifetime income-tax exemptions for mothers of multiple children, and subsidized housing for married couples, all of which has been explicitly marketed as the alternative to immigration (American Enterprise Institute [AEI], 2025; OSW, 2025). The spending on these policies has been extraordinary, with the government’s own accounting showing that family policy consumes around 5 per cent of GDP (AEI, 2025; OSW, 2025). And for a decade this approach seemed to be working: Hungary’s TFR climbed from 1.23 in 2011 to 1.61 in 2021, the second-largest fertility increase among 52 OECD countries over that period (OSW, 2025).
Then in 2022, the tide went out. Since then, Hungarian births have started to fall again despite expanding policy, in 2023 the country recorded the EU’s third-largest population decline; analysts increasingly attribute the earlier gains partly to tempo effects (which is when births occur earlier than they otherwise would have, not that the births were added to what would have been) and the recent slump to macroeconomic conditions and public mood (OSW, 2025; Lutz et al., 2024). A similar series of events unfolded in Poland where its child-benefit program helped lift family spending from 1.8 to 3 per cent of GDP after 2015, yet fertility rose only marginally before resuming its decline (Bordás, 2022). The literature’s verdict is consistent in that cash and housing support produce real but modest effects. One recent synthesis suggests that roughly US$250 billion in additional annual spending buys something like 0.2 extra children per woman (AEI, 2025).
7. Why Birth Rates Are Falling: The Anatomy of a Decline
In the most influential recent study of the question, Kearney, Levine and Pardue (2022) examined the post-2007 collapse of American births (which was a 20% decline) and systematically tested the usual suspects: recessions, rents, student debt, childcare costs, policy shifts. Beyond the initial shock of the Great Recession, no measurable economic or policy variable could statistically account for much of the decline. In other words the fall was too broad to pin on any single price or program. Their conjecture, which is now the touchstone of the field, is that the driver is a generational change in “shifting priorities” wherein successive cohorts simply weigh parenthood differently against things like careers, leisure, and intensive modern parenting norms (Kearney et al., 2022). With that humility established, four factors clearly shape the way that those priorities form.
7.1 The price of admission: housing and the cost of living
Even if rising costs can’t explain the whole decline, they are nevertheless a meaningful contributing factor. Housing is the clearest case, because a home is a precondition to what many people imagined when they think of having a family. In Canada, an entry-level home in many major cities costed roughly three times a young couple’s income in 2000, but that ratio has since climbed dramatically, enriching existing homeowners while pricing out would-be parents (The Hub, 2026b). In Seoul, South Korea, median apartment prices exceed one billion won, and total child-raising costs are estimated at up to 500 million won (roughly US$375,000), which ranks among the heaviest burdens on earth, with much of it driven by the private-tutoring arms race that consumes Korean family budgets (Seoul Vision 2030, 2026). Chinese families also cite housing and education costs as the reason they’ve only been producing one child on average even though they’re now permitted to have up to three (PBS News, 2026).
7.2 The postponement machine: delayed marriage and childbearing
Another significant factor in the developed world is that modern adulthood has become a longer runway with more checkpoints: degree, career establishment, partner, property, and only then, perhaps, children. Each checkpoint pushed later compresses the fertile window that remains. In Canada, the average age at which a mother gives birth to her first child reached a record 31.8 in 2024, up from 26.7 in 1976 (Statistics Canada, 2025). In South Korea, where about 95 per cent of births occur within marriage, the collapse and recent partial recovery of the marriage rate translates almost mechanically into the birth rate (The Korea Herald, 2025). Postponement matters because it converts “later” into “fewer” and sometimes into “never”: a couple beginning at 34 simply won’t have the same size family that a couple beginning at 26 will, whatever their intentions.
7.3 Education, careers, and the changed calculus for women
The single most powerful long-run predictor of fertility decline is the expansion of women’s education and economic opportunity. This expansion represents an enormous gain in human welfare, but its demographic side-effect is fewer and later births (World Bank, 2025). Women, for the first time in human history, have real professional options in most of the developed world, and because of this many choose to spend their lives being something other than a mother.
7.4 The wanting gap
One of the most puzzling pieces we’re confronted with when assessing the low-fertility problem is that stated desires have fallen far less than behaviour. Canadian women without children report wanting an average of 2.2 children yet the realized national rate is 1.25 (The Hub, 2026a). Statistics Canada frames this gap between intentions and outcomes as evidence of structural constraints including marital status, education, and employment intervening between the family people imagine having and the one they actually have (Global News, 2026). Then layer onto this the broader cultural currents like individualism, secularization, intensive-parenting norms that raise the perceived standard for being a “ready” parent, and a generalized unease about the future, and the picture that emerges is not of a society that stopped wanting children, but of one that keeps raising the social bar for what is required to have them (Kearney & Levine, 2022; The Hub, 2026a). That distinction matters enormously for policy because a gap between what people want, and what people get, is arguably a market failure that the state can address.
8. Debates and Solutions
8.1 Pronatalism: necessary, insufficient
The evidence discussed in Section 6 supports two verdicts on pronatalist policy. On one hand, the claim that “governments can restore replacement fertility with subsidies” has failed everywhere it’s been tested. South Korea spent roughly US$270 billion between 2006 and the mid-2020s while its TFR fell in almost every year of that period (Al Jazeera, 2025; Seoul Vision 2030, 2026); Hungary’s 5% of GDP effort peaked well short of replacement before receding (OSW, 2025); and even the famously generous Nordic countries have slid to record lows, with Finland at 1.25 matching Canada (Statistics Canada, 2025).
On the other hand, the claim that “policy can move fertility modestly and improve family welfare regardless” has some real support. Quebec’s low-fee childcare, introduced in 1997, raised the likelihood of a first or second birth among women aged 20–24 by 7 percentage points (The Hub, 2026a). Korea’s recent two-year rebound coincided with an intensified package of cash grants, housing support, expanded parental leave, and even unique programs like municipal matchmaking (Nikkei Asia, 2026; Al Jazeera, 2025; CBC News, 2026). So, this paper’s contention is therefore that pronatalist policy is best understood not as a fix to the pernicious demographic problem of wanning fertility, but as a way for closing the wanting gap. Which is worth doing on its own terms, but a country should not expect to meaningfully increase their fertility rates by adopting said policy.
8.2 Immigration: the fix that imports its own debates
Immigration is the one intervention with immediate and guaranteed effect, and it carries with it lots of genuine advantages. For instance, newcomers arrive at working-age, the receiving country can target skilled labour to ease labour shortages, and capture human capital whose costly childhood years were financed somewhere else. But there are nevertheless three caveats that come with immigration. First, immigration treats the symptom (population size and age structure) instead of addressing the condition (low fertility). Second, it’s politically volatile as Canada’s own abrupt policy reversal after 2024 demonstrates (PBO, 2026). Third, and least discussed, is that it’s a strategy that has an expiry date: as fertility falls in the regions where immigrants are usually sourced from like South Asia and Latin America the international competition for young, skilled migrants will tighten. Countries that treat immigration as an infinite tap will discover, sometime in the middle of the century, that they are drawing from a shared and shrinking reservoir (UN, 2024; Visual Capitalist, 2026a).
8.3 Technology: substituting capital for cradles
The third lever to mitigating the negative effects that flow from low fertility is simply to need fewer people for your economic system to run. Essentially, to let automation, robotics, and artificial intelligence absorb the work a missing generation would have done. This is a proposition that is being taken much more seriously in recent years with analysts of China’s economy arguing that rapid advances in high-tech manufacturing and robotics can partially offset a shrinking labour force, even though they doubt those advancements can fully escape the demographic situation (PBS News, 2026). Economists such like Kearney and Levine (2022) also point to productivity growth, alongside immigration, as the realistic adjustment that the American economy should make vis-à-vis their low fertility. The limits, however, that technological advancements have as a remedy for population decline are evident, for example machines don’t pay taxes into pension systems; they don’t consume anything, which dampens the demand side of the economy; and they can’t supply the care and community that real humans offer. So the final insight on this section is that technology may be able to compensate for missing workers, but it can’t compensate for missing people.
9. What This Means for Canada
9.1 Where we stand
As discussed, Canada has one of the world’s lower fertility rates, and that’s paired with one of its highest dependencies on immigration. This leaves Canada in a highly exposed position. To recap, the national TFR of 1.25 in 2024 marks the country’s second consecutive year in “ultra-low territory”, and fifteen years of virtually uninterrupted decline since 2009. Nine provinces and territories set record lows rates, with British Columbia at 1.02, and only Nunavut maintains a fertility rate above replacement (2.34) (Statistics Canada, 2025). Another striking statistic is that over half of Canadian women aged 20 to 49 currently have no children, and the number of women over 50 with no children has risen from 14.1% in 1990 to 17.4% (Statistics Canada, 2026). Meanwhile the retirement of boomers are peaking with every remaining boomer reaching the age of 65 by 2030 (Global News, 2025).
9.2 The wager under stress
For decades, Canada’s answer to low fertility was simple: what the maternity ward doesn’t supply, the visa office will. That answer is now being stress-tested. On the supply side, if not for foreign born mothers, births would have been shrinking since 2010 who, as we know, now account for 42.3% cent of newborns (Statistics Canada, 2026), this means that immigration is no longer just supplementing Canadian fertility but substantially contributing to it.
On the policy side of things, the Immigration Levels Plan pulls back heavily on permanent admissions (which are now being held to 380,000, a fifth below the 2024 record), and new temporary-resident arrivals are being cut by more than 40%, producing what is projected to be near-zero population growth in 2026 and 2027 (PBO, 2026; Gowling WLG, 2025). Canada is setting precedent here, in effect, it’s going to show the rest of the world what happens to an ultra-low-fertility country when it voluntarily closes most of its only growth channel. The early evidence that we have points to flat population, and a depleting domestic labour pool (Global News, 2025; PBO, 2026). When we also consider the peak boomer retirement drag that’s arriving it seems like the margin for error on the fertility crisis is thinner than the political debate acknowledges.
9.3 The strategic ideas
Three ideas should organize Canadian policy-thinking for the next quarter-century. First, economic competitiveness: if population growth settles near 0.8 per cent and the labour force stops growing (PBO, 2026), Canada’s existing productivity problem becomes the entire growth strategy — every point of GDP must come from doing more per worker, not adding workers.
The second idea is fiscal architecture: health care, the Canada Pension Plan, and Old Age Security were all designed to exist with a younger age structure, the boomer retirement wave tells us that the debate over how we plan to recalibrate the system cannot be deferred to the 2030s.
Third, and most delicate, national identity: a country in which a large and increasing share of its population arrives through immigration has to continuously renew the civic story that binds the newcomers and the native-born residents into one political community. While a country that instead lets itself shrink in an effort to preserve its existing identity (like Hungary) must decide which regions, institutions, and ambitions to wind down. Canada has been able to avoid choosing between a pronatalist strategy and an immigration strategy because immigration seemed limitless and costless. But the 2024–2026 political debates revealed otherwise. The mature position is that Canada needs both. We need pronatalist policy to the extent of closing the wanting gap between the 2.2 children Canadians say they want and the 1.25 they are having (The Hub, 2026a), but we also need to continue relying heavily on immigration in the short-term. Future papers will explore how continues reliance on immigration is justified vis-à-vis the tight domestic housing supply.
10. Conclusion
Most of the world is descending murky waters with fertility rates declining in almost every region on earth, and yet nothing on the record suggests panic; Japan’s orderly decades demonstrate that population decline is a condition to be managed, not a cliff that leads to catastrophe. But nothing suggests complacency either, because demography is the ultimate lagging indicator: the workforce of 2050 has, for the most part, already been born or not born, and every year below replacement narrows the base from which any future recovery has to be multiplied. The countries that fare best will be those that treat replacement level birth rates not as a culture-war trophy but as piece of critical infrastructure that the rest of society is built atop.
So, the forward-looking question this essay leaves with the Canadian reader with is this: if Canadians want 2.2 children and are only having 1.25, what exactly — in housing, in child care, in the structure of working life — is standing in the nine-tenths of a child between those numbers, and which of those obstacles is Ottawa actually prepared to remove?
References
Al Jazeera (Lee, D. D.). (2025, March 3). How did South Korea start producing more babies after long decline? https://www.aljazeera.com/features/2025/3/3/how-south-korea-raised-its-birthrate-love-bingo-parental-support-and-more
American Enterprise Institute. (2025, November 21). Hungary’s fertility outcomes highlight pro-natal policy limitations. https://www.aei.org/op-eds/hungarys-fertility-outcomes-highlight-pro-natal-policy-limitations/
Aspen Economic Strategy Group. (2025, May 2). AESG insights: The economics of falling birth rates. https://www.economicstrategygroup.org/publication/falling-birth-rates/
Bordás, M. et al. (2022). The propensity to have children in Hungary, with some examples from other European countries. Frontiers in Sociology / PMC. https://pmc.ncbi.nlm.nih.gov/articles/PMC9755853/
CBC News (Yoon, J.). (2026, June 17). Cute, tiny and in short supply: What can Canada learn from South Korea’s birthrate turnaround? https://www.cbc.ca/news/world/south-korea-birthrate-turnaround-9.7238102
CNN. (2025, June 5). Japan’s annual births fall to record low as population emergency deepens. https://www.cnn.com/2025/06/05/asia/japan-birth-rate-record-low-intl-scli
Espenshade, T. J., Guzman, J. C., & Westoff, C. F. (2003). The surprising global variation in replacement fertility. Population Research and Policy Review, 22(5–6), 575–583. https://www.researchgate.net/publication/227040148_The_Surprising_Global_Variation_in_Replacement_Fertility
Georgetown Journal of International Affairs (Park, H.). (2024, September 24). The necessary paradigm shift for South Korea’s ultra-low fertility. https://gjia.georgetown.edu/2024/09/24/the-necessary-paradigm-shift-for-south-koreas-ultra-low-fertility/
Global News. (2025, September 25). Canada is seeing its largest retirement wave as fertility rate plummets. https://globalnews.ca/news/11450130/canada-largest-retirement-wave-fertility-rate/
Global News. (2026, January 27). Nearly 1 in 4 Canadian women in their 40s don’t have kids: StatCan. https://globalnews.ca/news/11638221/canada-ultra-low-fertility/
Gowling WLG. (2025, November 7). Canada’s 2026–2028 Immigration Levels Plan from Budget 2025 — A focus on sustainable growth and skilled talent. Lexology. https://www.lexology.com/library/detail.aspx?g=482a78b0-8f71-495c-a063-67879fad0127
Immigration, Refugees and Citizenship Canada. (2025, November 4). Supplementary information for the 2026–2028 Immigration Levels Plan. Government of Canada. https://www.canada.ca/en/immigration-refugees-citizenship/corporate/mandate/corporate-initiatives/levels/supplementary-immigration-levels-2026-2028.html
Kearney, M. S., & Levine, P. B. (2022). The causes and consequences of declining US fertility. Aspen Economic Strategy Group. https://www.economicstrategygroup.org/publication/kearney_levine/
Kearney, M. S., Levine, P. B., & Pardue, L. (2022). The puzzle of falling US birth rates since the Great Recession. Journal of Economic Perspectives, 36(1), 151–176. https://www.aeaweb.org/articles?id=10.1257/jep.36.1.151
Kim, C. Y., & Chung, S. H. (2025). The predetermined future: Tackling South Korea’s total fertility rate crisis. Clinical and Experimental Pediatrics / PMC. https://pmc.ncbi.nlm.nih.gov/articles/PMC11884948/
Lutz, W., Sobotka, T., & Zeman, K. (2024, March 4). Evaluating pronatalist policies with TFR brings misleading conclusions: Examples from Hungary. N-IUSSP. https://www.niussp.org/fertility-and-reproduction/evaluating-pronatalist-policies-with-tfr-brings-misleading-conclusions-examples-fromhungary/
McMaster University. (2026, June). Canada’s declining fertility rate: Q&A with expert Bruce Newbold. McMaster News. https://news.mcmaster.ca/canadas-declining-fertility-rate-qa-with-expert-bruce-newbold/
Nikkei Asia. (2026, February 25). South Korea’s fertility rate rises for second year as marriages increase. https://asia.nikkei.com/economy/demography/south-korea-s-fertility-rate-rises-for-second-year-as-marriages-increase
Nippon.com. (2026, January 17). Births in Japan hit new record low in first half of 2025. https://www.nippon.com/en/japan-data/h02522/
Office of the Parliamentary Budget Officer. (2026, February 26). Demographic implications of the 2026–2028 Immigration Levels Plan. https://www.pbo-dpb.ca/en/publications/RP-2526-025-S—demographic-implications-2026-2028-immigration-levels-plan—implications-demographiques-plan-niveaux-immigration-2026-2028
OSW Centre for Eastern Studies (Sadecki, A.). (2025, April 14). Hungary’s ongoing demographic decline: An increase in birth rates is the only hope. https://www.osw.waw.pl/en/publikacje/osw-commentary/2025-04-14/hungarys-ongoing-demographic-decline-increase-birth-rates-only
Our World in Data. (2025). Fertility rate. https://ourworldindata.org/fertility-rate
PBS News. (2026, January 19). China’s population falls again as birth rate drops to lowest since 1949. https://www.pbs.org/newshour/world/chinas-population-falls-again-as-birth-rate-drops-to-lowest-since-1949
Pew Research Center. (2025, August 15). 5 facts about global fertility trends. https://www.pewresearch.org/short-reads/2025/08/15/5-facts-about-global-fertility-trends/
Semafor. (2025, December 29). Japan’s birthrate falls to historic lows. https://www.semafor.com/article/12/29/2025/japans-birthrate-falls-to-historic-lows
Seoul Vision 2030 (Vanderbilt, D.). (2026, March 22). Korean fertility crisis — 0.72 TFR, world’s lowest birth rate, and the $270 billion policy failure. https://seoulvision2030.com/briefs/korean-fertility-crisis-global-lowest/
Statistics Canada. (2025, September 24). Fertility and baby names, 2024. The Daily. https://www150.statcan.gc.ca/n1/daily-quotidien/250924/dq250924d-eng.htm
Statistics Canada. (2026, April 22). Canada’s total fertility rate reaches a new low in 2024. StatsCAN Plus. https://www.statcan.gc.ca/o1/en/plus/9140-canadas-total-fertility-rate-reaches-new-low-2024
The Hub. (2026a, April 14). With a record-low 1.25 children per Canadian woman, stop dismissing falling fertility rates as a choice. https://thehub.ca/2026/04/14/with-a-record-low-1-25-children-per-canadian-woman-stop-dismissing-falling-fertility-rates-as-a-choice/
The Hub. (2026b, April 17). Canada’s fertility rate has hit a record-low 1.25 as costs push family formation out of reach. https://thehub.ca/2026/04/17/canadas-fertility-rate-has-hit-a-record-low-1-25-as-costs-push-family-formation-out-of-reach/
The Japan Times. (2026, February 26). Number of births in Japan falls to record low for 10th straight year. https://www.japantimes.co.jp/news/2026/02/26/japan/society/japan-birth-record-low/
The Korea Herald. (2025, May 29). Has baby bust bottomed out? S. Korea sees 7% rebound in births in Q1. https://www.koreaherald.com/article/10497796
Time (Suhartono, H., et al.). (2024). How South Korea should tackle its low birth rate, according to experts. https://time.com/6962867/south-korea-low-fertility-rate-birth-cash-programs-quality-life/
Todayville. (2025, October 11). Canada’s birth rate plummets to an all-time low. https://www.todayville.com/canadas-birth-rate-plummets-to-an-all-time-low/
Tokyo Weekender. (2026, June). Japan births hit record low as population decline deepens. https://www.tokyoweekender.com/japan-life/news-and-opinion/japan-births-hit-record-low/
United Nations. (2024, July 11). UN projects world population to peak within this century. https://www.un.org/en/UN-projects-world-population-to-peak-within-this-century
United Nations, Department of Economic and Social Affairs, Population Division. (2025). World Fertility 2024 (UN DESA/POP/2025/TR). https://www.un.org/development/desa/pd/sites/www.un.org.development.desa.pd/files/undesa_pd_2025_wfr_2024_final.pdf
Visual Capitalist. (2025, December 28). All of the world’s births in 2025 in one giant chart. https://www.visualcapitalist.com/worlds-births-2025-by-country-giant-chart/
Visual Capitalist. (2026a, May 27). Visualized: The fertility rate of the world’s populations. https://www.visualcapitalist.com/fertility-rate-of-world-populations/
World Bank. (2025, July 14). World Population Day: Trends and demographic changes. World Bank Data Blog. https://blogs.worldbank.org/en/opendata/world-population-day—trends-and-demographic-changes
Xinhua. (2026, February 25). S. Korea’s total fertility rate hits 4-year high in 2025. Capital Business. https://www.capitalfm.co.ke/business/2026/02/s-koreas-total-fertility-rate-hits-4-year-high-in-2025/
Yi, F. (2026, January 28). Can China reverse its demographic decline? The Japan Times. https://www.japantimes.co.jp/commentary/2026/01/28/world/reversing-china-demographic-decline/