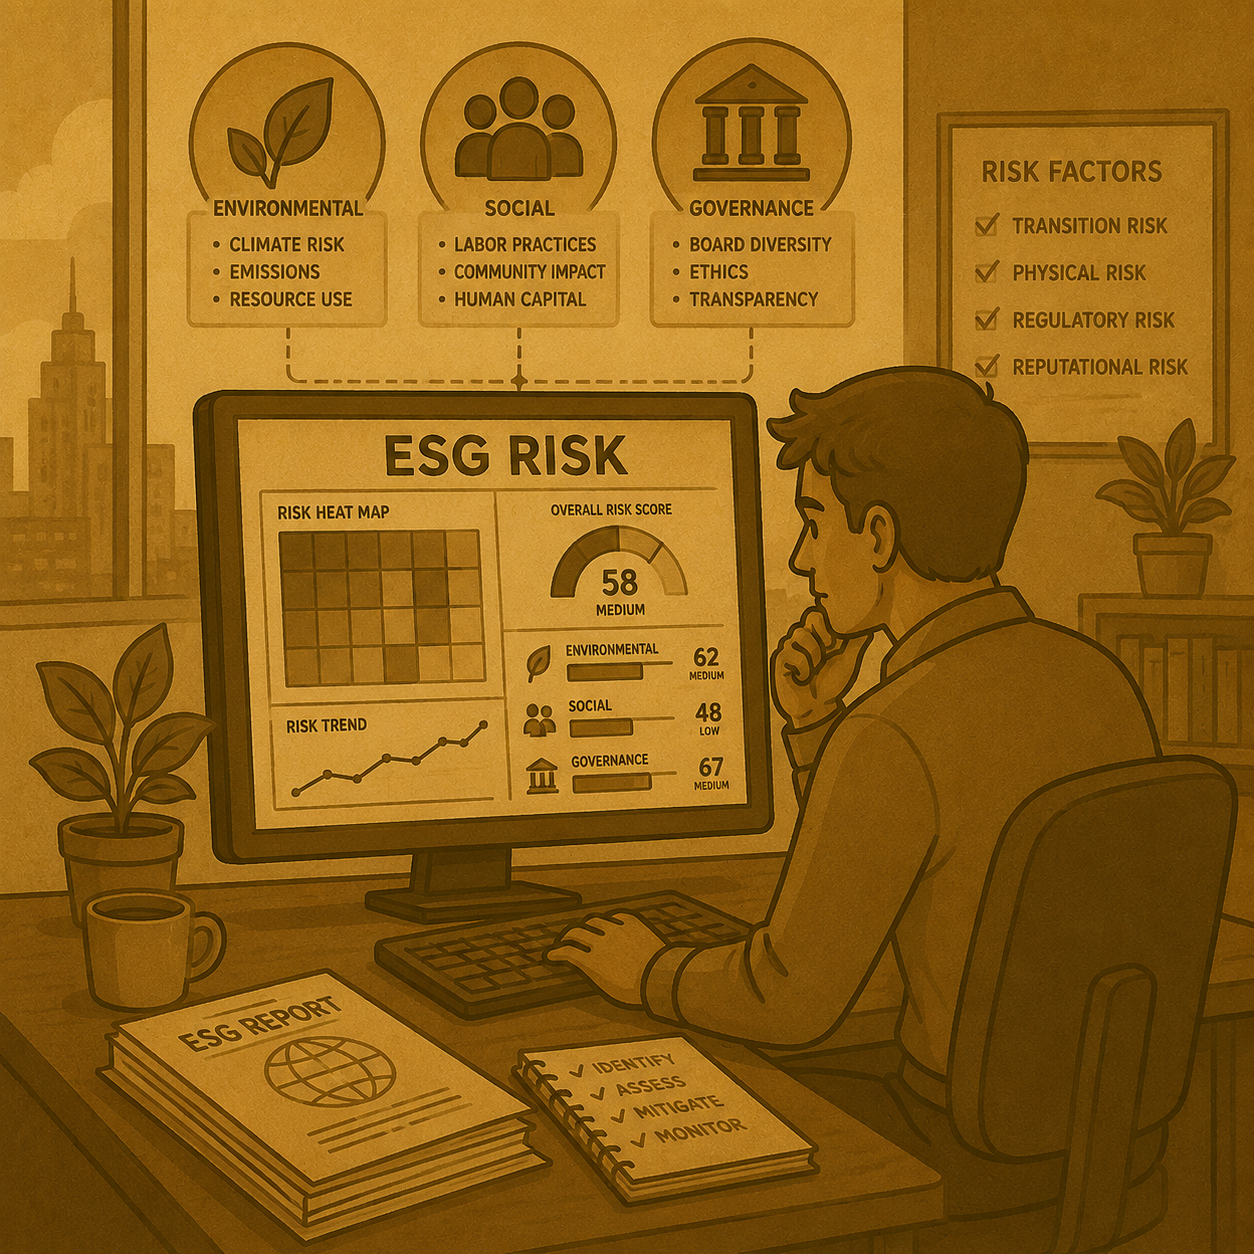
Dashboard
Corporate ESG Risk-Scoring Model
I built this Excel-based ESG risk-scoring model for my student investment fund to give our investment teams a clearer, more consistent view of the environmental, social, and governance risks facing the companies they analyze.
Try the tool
Tool not loading? Open it in a new tab.
I built this Corporate ESG Risk-Scoring Model for my university’s student investment fund so that our investment teams could develop a clearer and more consistent risk profile of the companies they’re analyzing. ESG issues often appear in separate reports, disclosures, news articles, and management commentary, which makes them difficult to compare. I wanted to create one structured model that could bring those inputs together and show where a company’s largest risks actually sit.
The model assesses 24 environmental, social, and governance factors. For each factor three things are evaluated: the company’s level of exposure, the strength of its management controls, and the quality of the available data. Those qualitative selections are then converted into numerical scores on a 0–100 scale through lookup tables in the scoring engine.
One of the main features of the model is that it separates inherent risk from residual risk. Inherent risk reflects how exposed the company is before considering its controls. Residual risk estimates how much of that exposure remains after management systems are taken into account. This is the formula I used to calculate it:
Residual Risk = Exposure Score × [1 − (Management Score ÷ 100 × Maximum Mitigation)]
I set the default maximum mitigation level at 70%. This was a deliberate choice because I didn’t want the model to suggest that strong management could fully eliminate a major underlying risk. For instance, a mining company might have strong environmental policies and monitoring systems, but it’s still going to face meaningful land-use, water, safety, and emissions exposure because of the nature of its operations.
I also treat data quality separately from actual ESG performance. Limited ESG reporting doesn’t automatically mean that a company is poorly managed, but it does make the assessment less certain. The model therefore adds an uncertainty adjustment when the available information is weak. This allows me to distinguish between a genuinely low-risk company and one that only appears low-risk because there isn’t enough reliable data.
The scoring engine uses weighted averages to calculate environmental, social, and governance pillar scores. I included standard weights, industry-recommended weights, and custom weights because ESG materiality varies so much by sector. For example, environmental risk is likely to receive more weight for a mining or oil and gas company, while governance risk may be more important for a financial institution or technology company.
I also built a separate controversy adjustment that considers recent incidents like regulatory penalties, litigation, workplace fatalities, environmental spills, human-rights allegations, data breaches, and misleading disclosure claims. The controversy score is added after the underlying residual-risk calculation, which helps prevent serious recent events from being buried inside an average.
The dashboard pulls everything together through heat maps, scenario comparisons, management-gap analysis, priority rankings, and charts. It also identifies the highest-priority risks and generates recommended actions based on the actual results. I included Base, Adverse, Improved Management, and Custom scenarios so that our analysts can test how the company’s score changes when exposure, controls, or controversy assumptions shift.
I’ve made the model available for download so have fun with it!